WQPredict
Modeled nutrient concentrations and loads for stream monitoring sites across Canada and the United States.
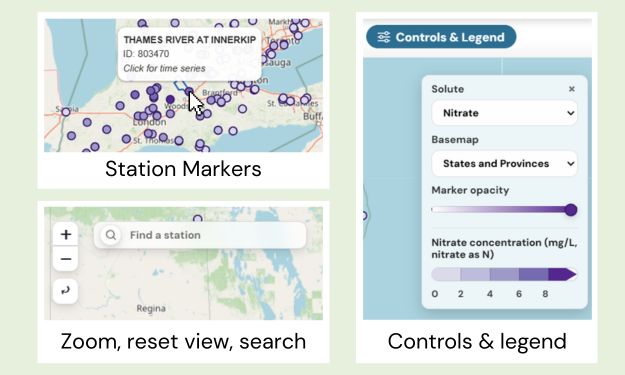
Using the map
Each point is a monitoring site
Zoom and drag over map to navigate
Use search to find a specific site
Change visible solute using dropdown
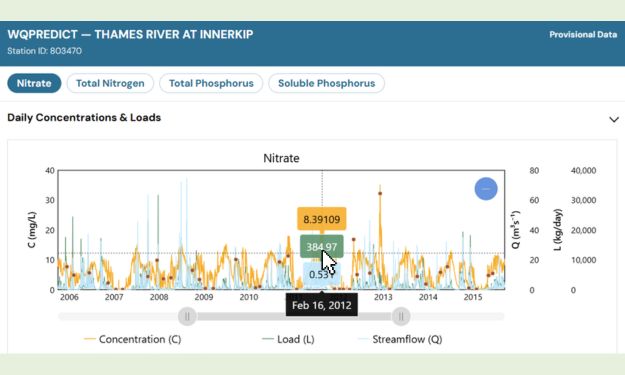
Site details & charts
Click marker to open time series window
Hover to view values
Compare loads and concentrations
Toggle solutes using top buttons